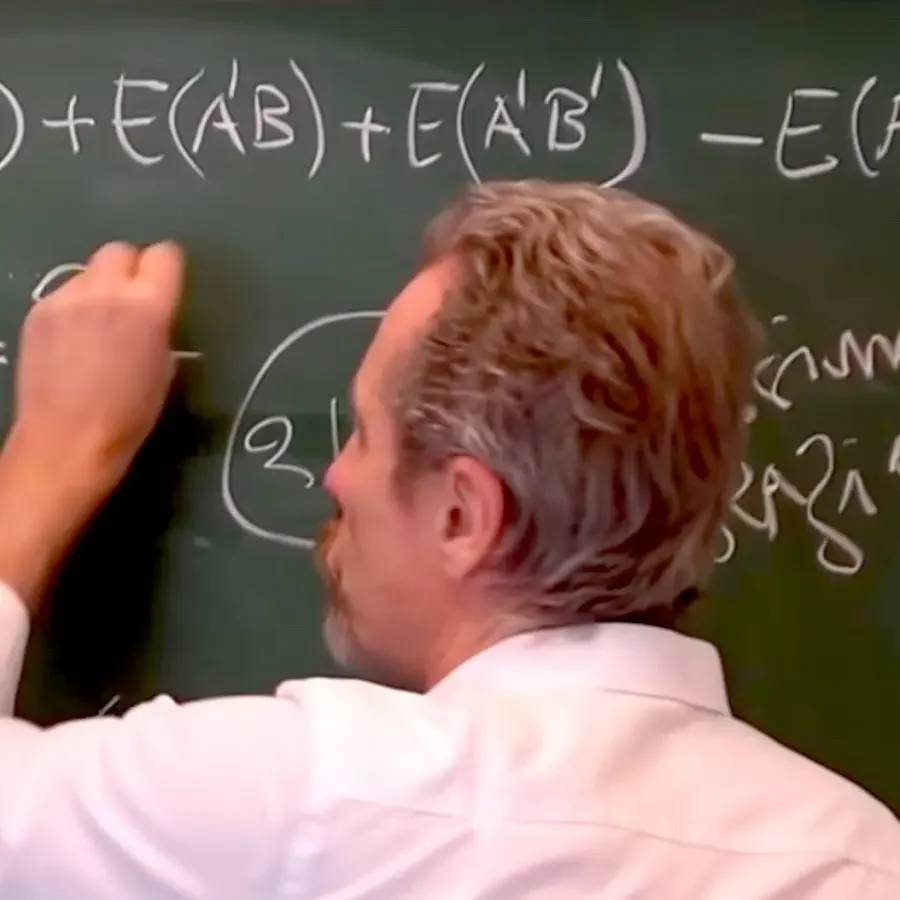
In questo video vi spiegherò come sia possibile trasformare un farmaco con efficacia estremamente bassa, o addirittura zero, in un farmaco di grande efficacia, commettendo degli errori nel modo in cui vengono categorizzati i dati sperimentali. Lascio a voi decidere, tramite una vostra indagine personale, se ci sono stati errori di questo genere, di recente, nel valutare particolari trattamenti profilattici, e se questi errori erano volontari o involontari. Ad ogni modo, indipendentemente dal fatto che quello di cui parleremo abbia pertinenza o meno con recenti situazioni sanitarie, sicuramente si tratta di un piccolo esercizio matematico che ha il suo interesse a prescindere. Questa mia analisi è ispirata da quanto esposto di recente dal matematico Norman Fenton e dall’informatico Martin Neil.
PS: Molte persone hanno chiesto a Norman Fenton e Martin Neil perché includevano le persone trattate nel periodo kτ, nel denominatore dell’espressione per calcolare p'_(k+q), se tali persone sono state classificate come ufficialmente non trattate. Cioè, perché considerare un punto (2) e un punto (3) manifestamente contraddittori? (E stessa cosa per i punti (1) e (4). La loro risposta è che negli studi osservazionali le persone trattate e ammalate da un tempo inferiore a kτ vengono classificate come non trattate, mentre quelle che non sono ammalate (che non sono positive) vengono catalogate come trattate a prescindere da considerazioni di intervalli temporali. Questo perché non esiste un gruppo trattato e un gruppo non trattato ben distinti, come avviene nell’ambito di una sperimentazione controllata, e tutto è guidato dall’osservazione dei “casi”. Questo modo di procedere porta a commettere, affermano sempre questi autori, gli errori in questione nella quantificazione dei “denominatori”, e citano come esempio quello del NIMS: National Immunisation Management System.
Per visionare il lavoro di questi autori, fare una ricerca inserendo "The illusion of v*****e efficacy revisited. How to make a placebo look 95% effective and guarantee repeat business"
Per una lista di studi che commettono questo genere di errori di classificazione, fare una ricerca inserendo "The Very Best of Cheap Trick..... How widespread is the (mal)practice of miscategorising vacc****ion status?"
WARNING: il fatto che in alcuni studi vengano usati dei trucchi per gonfiare i dati di efficacia (o relativi agli effetti avversi), non significa, ovviamente, che tutti gli studi siano di questa natura. Scopo di questo video non è rimettere in questione la ricerca farmacologica nel suo assieme (ci mancherebbe) ma attirare l'attenzione su situazioni specifiche di mal pratica nella classificazione dei dati, che è importante imparare a riconoscere e denunciare. Secondo Norman Fenton e Martin Neil, questi "errori" di classificazione possono essere raggruppati in quattro categorie: (1) I trattati da troppo poco tempo (solitamente due o tre settimane) vengono classificati come non trattati, o i trattati due volte vengono classificati come trattati una volta, ecc. (2) I trattati che non possono essere verificati come tali vengono classificati come non trattati. (3) I trattati da troppo poco tempo (solitamente due o tre settimane) non vengono assegnati né alle categorie dei non trattati né a quelle dei trattati e vengono semplicemente rimossi dall'analisi. (4) Le definizioni di trattato e non trattato vengono lasciate intenzionalmente indefinite.
It is possible to transform a low-efficiency drug, or even zero-efficiency, into a high-efficiency drug, simply by rearranging the statistical data a little bit.
Now I'll explain.
Today I would like to talk to you about something that has been recently exposed by the mathematician Norman Fenton and the computer scientist Martin Neal.
These two scholars have shown Excel tables with calculations, and these calculations show that it is possible to inflate the effectiveness of a drug in an extraordinary way, if only the observational data are categorized in a certain way.
I will not put a link to their work, which you will find using a search engine, because this platform is a little too sensitive to certain topics.
Of course, I will talk to you about an imaginary reality, something that has never happened on this planet.
Obviously, it is hoped that people who are addicted to the control of data, people who are addicted to the control of diseases and prevention, know how to do their job.
Obviously, they don't do things like the ones I'm going to tell you about now.
Or do they? Well, I'll let you decide.
Look at what has happened in recent times and I'll let you decide to what extent some of the things I'm talking about today have really happened.
That is, the data that has been provided, for example, of the effectiveness of certain drugs administered for the purpose of prevention, were data that were sensible, even if they were essentially the result of a sort of statistical illusion.
Okay, so it's all very simple, but you have to be a little careful because you have to introduce a notation.
I have to introduce a whole series of variables, of quantities, and then with these quantities, trying not to get too involved, derive the two or three formulas that we have to derive.
So let me clear the table, that is, in the sense of defining the context.
The context is a certain population, let's say that this population has a total number of inhabitants of n.
You can imagine that it is a million, ten million, it's up to you, it's not that important.
Well, these inhabitants, in a total time interval, T total, are supplied with a drug for preventive purposes, to fight a not better specified disease.
Now, this supply takes place, let's say, in tranche, in subsequent periods of time, and let's say that there are m subsequent periods of time, and each of these periods of time has a tau duration.
And in each of these periods of time n people are supplied, so n total will simply be m times n.
On the other hand, people who receive the treatment will be characterized by a rate of disease that is different from p', and obviously this rate of disease of people who receive the treatment is expected to be lower.
So it is p minus p' to which I still divide by p, so I can also write as 1 minus p' divided by p.
Now let's see immediately that if p' is equal to 0, that is, the percentage of disease is 0, that is, those who take the drug do not get sick anymore, then we will have the effectiveness equal to 1, 100%, an extremely effective drug.
If p' is equal to p, p' divided by p becomes 1, 1 minus 1 is 0, it means that the drug is not absolutely effective, it is worse than a placebo, because obviously it does not modify in any way this rate of disease.
Now, by doing this, we come to an estimate that should be correct at every moment, so the supply campaign starts from time t1 which is tau, then continues to time t2, 2 tau and goes on until the final time tm which is equal to m tau.
At each of these times it is possible to estimate the effectiveness of the drug up to that moment.
Well, now to do this we have to specify what the prescriptions are.
So, what are these prescriptions?
Well, the first prescription is simply this, which are considered as officially untreated patients, not only untreated people, but also all those people who have already been treated if more than a certain time has not passed from the treatment.
And this time we will say that it is a time k times tau, that is, if for example tau is expressed in weeks, k will be a certain number of weeks.
That is, if a certain number of weeks have not passed from the assumption of the drug, the sick person is officially considered as untreated.
For example, in the application that we will do in specific cases, we will take the case where you have to wait at least three periods, three weeks.
Obviously it is an absurd thing to think about, because obviously when you go to calculate efficiencies, you want those efficiencies to be representative of the moment in which the drug is taken.
But let's say in this imaginary world, a little in the midst of madness, it happens that this criterion has been suggested and even adopted.
Obviously the second criterion, consequence of the first, is that people who have been treated are considered as officially treated sick people, but who have received treatment for at least a time k tau.
Then there are still two prescriptions that complete this somewhat bizarre picture, which consist of defining which people are officially treated and untreated when they are not sick.
So when they are not sick, the officially treated people are all treated people, regardless of whether they have been treated for less or more than k tau.
Similarly, they are considered as officially untreated people, exclusively untreated people, therefore without including those we had included before.
These are the prescriptions. Again, I do not go into the merits, if human madness is able to produce prescriptions of this type, or if this is just a small didactic, imaginary exercise.
Well, now we want to calculate these efficacies that we can deduce from observational data using these prescriptions.
What is the time we can do the first assessment?
Well, the time we can do the first assessment is after the time tk, because we have to wait at least a period k tau, because if that time has not passed at least k tau, we do not have officially treated people, so we cannot estimate anything.
But from the time tk plus something, let's call this something q, then we can obviously start to estimate the effectiveness.
Here, of course, q can be 1, 2, 3, on and on, up to m minus k minus 1.
Why up to m minus k minus 1? Because if q is equal to 1, we have tk plus 1, this is the first moment in which we can make an estimate of the effectiveness.
But we will take a generic moment tk plus q and with this generic moment we want to calculate the effectiveness at the time k plus q, which will be 1 minus p first k plus q divided by pk plus q.
What is this? These are the official disease rates at the time tk plus q. This is the rate for officially ill and untreated people and this is the rate for officially ill and untreated people.
And now we have to estimate these two quantities.
How can we characterize the first quantity?
Let's start with this first quantity, pk plus q first.
What is it? It is the ratio between the number of officially ill and treated people at the time k plus q divided by the number of officially treated people at that moment.
Now I have to estimate these people here, those officially ill and treated.
Now those officially ill and treated I know that they are only those who have been treated for longer than kt.
So I can't look at things at the moment tk plus q, but I have to start from the moment tq.
This moment is given by tq plus kt, so I have to start from here because only up to this moment the people who have been treated have been officially treated when I consider them in the situation in which they are ill.
So here I obviously have to consider the number of people up to this moment and the number of people up to this moment is nq, so q times n.
And since I want to consider these people as ill, I have to apply the treatment rate for the treated people, p first times nq.
And here I have to divide by the total number of officially treated people, and as I explained before, in this case there is no longer this time criterion.
So in this case I will have nk plus q.
So this expression gives me p first times nq, which is q times n, divided by k plus q times n.
The n's obviously simplify and I remain with p first times q divided by k plus q.
So this is the formula for the official treatment rate at the moment tk plus q.
All right, so far so good.
Among other things, if you look at this expression as a function of q and derive it from q, you see that it is a function that grows with q, so this treatment rate grows over time.
Okay, now we have to calculate this quantity.
So to calculate this quantity I have to think in the same way, I have to write pk plus q, I have to say what this is.
What is this? Well, it is the number of people officially ill, not treated, k plus q at the moment, divided by the number of people officially not treated at the time k plus q.
Let's go here.
Now, here you have to understand again well that in the denominator the people officially not treated,
obviously these people are all the people who have been, let's say the total population, minus the number of people treated until the time k plus q.
Applying one of those prescriptions that says that again, no, there is no distinction of time.
Instead, above I have to put what?
Well, all the people who got sick, obviously among those not treated.
Now here I go on here, this denominator is obviously given by what?
From m minus k minus q times n.
Now, the people obviously not treated, who get sick, I have to use the sickness rate for the people not treated, multiplying it for all the people who have not yet received the treatment m minus k minus q times n.
But I also have to add what?
I also have to add obviously those people, according to that other prescription, who have not had the treatment for a long enough time, the famous time k tau.
And so I have to be able to add also, with the rate now of the people who have received the treatment, I have to do p first k n.
And obviously putting together what is here and what is here, the n's simplify.
So here I can remove this n, here I can write p n minus k minus q plus p first k.
And so now I have a formula here, a formula here, and to calculate the effectiveness I have to do one minus the ratio between these two expressions.
Among other things, even this sickness rate, if we derive this expression with respect to q, we see that the derivative is positive, so even in this case the sickness rate increases as time passes.
Now I delete and simply write the formula that is obtained simply from this, making the ratio between these two quantities, I do not do all the details, I give you the formula immediately, I delete.
So here I have written the expression that is obtained for the effectiveness of the drug at the time tk plus q, then k plus q per tau.
At this time, the assessment is this.
Now obviously this formula is a bit complicated, there are many terms and we are not interested, we have derived a general formula, but now let's try to look at a simple application.
The first thing we do is to say, but imagine that that drug is really zero effective.
If the drug is zero effective, you remember, zero effective is the same as p first equal to p.
So in the formula, if the effectiveness is zero, I get a simplified formula.
If the effectiveness is zero, the p first, p and p here are simplified.
So I will simply have 1 minus q over k plus q multiplied by m minus k minus q over m, here I will have m minus k plus k, so k goes away, m minus q.
So this is the simplified formula.
Now I want to take a particular case, I can take for example a case to put numbers in this formula.
So we choose k is equal to 3, that is, the waiting time for the drug until it becomes officially treated by a person who has received it is 3 weeks.
So k is equal to 3.
Suppose there are 10 periods of vaccination, that is, at the end of 10 periods the entire population has been vaccinated.
At this point, if you do the calculation, you will get 30 over 30 plus q over 7 minus q.
This is the formula in this case.
It is the formula specified k is equal to 3, m is equal to 10 for the situation where the drug is effective equal to zero.
And now, of course, I have to do the evaluations, that is, how much is e3 plus 1, that is, the first evaluation, then I will have e3 plus 2, etc.
Now, if you replace q with 1 within that expression, what do we have?
Well, we have 30, here we have 30 plus 7 minus 1, 6, here 1 does not change, 7 minus 1, 6, plus 6.
So 30 divided by 36 is 5 sixths and 5 sixths is more or less 0.833.
So more than 83% of the apparent effectiveness of this drug, thanks to this barbaric statistical trick of these strange and incoherent prescriptions, which, however, seem justifiable in some way.
It went from e equal to 0 to e3 plus 1 equal to about 83%.
Then, of course, if you calculate in time 2, if you do the calculation, you get that the rate goes down, etc., etc.
In reality, what you get is that the rate goes down and then, not the rate, sorry, the effectiveness goes down and then slowly starts to rise again.
For example, if you look at the tables of Norman Fenton and Martin Neal, they have percentages of drug supply that are not uniform like mine.
They put themselves in a situation where it always goes down.
Among other things, they deduce from their situation that even the fact that this effectiveness goes down can then be used by the evil manufacturer of this hypothetical drug, also to say that it is necessary to take it a second time.
Instead, if you model things as I did now, it goes down for a while.
Let's say that for half the campaign you can see that the effectiveness decreases, but then it starts to rise again.
Ok, more or less.
Then, of course, this was for the case in which the effectiveness is 0.
If it had a non-zero effectiveness, then using this strange trick again, you can bring, for example, an efficiency of 50% up to, for example, I don't know, 90%.
So you can still inflate it, even if it starts from a base that is not strictly zero.
But here it is shocking because it starts from a situation of a drug that is worse than a placebo, because the placebos have a certain effectiveness for the fact that they are supplied, so this is worse than a placebo.
And even then it receives an efficiency of more than 83%.
All right.
Moral of the story, because here I stop, we must be extremely attentive to how the statistics that feed us are built.
Because, as the saying goes, the devil is in the details.
Thanks for listening.