In certain times, you would like to split a higher grain number into lower grain by using some percentage ratios. For example, if you have a budget for Product Brand all up, we want to split further the budget into Product Names based on last year’s sales percentage ratios. You can do this by:
- a. Power Query – merging the budget table with ratios table
- b. Virtual Table – creating a virtual table with all the rows of the budget table merged with ratios table
- c. DAX – simply by creating a DAX formula multiplying budget high level table with ratios table.
- In many cases, I am going for the third option – especially when my budget table already has million rows and I need to further split it by 10x or more – file size becomes crucial. Let me explain how we do that using a DAX formula.
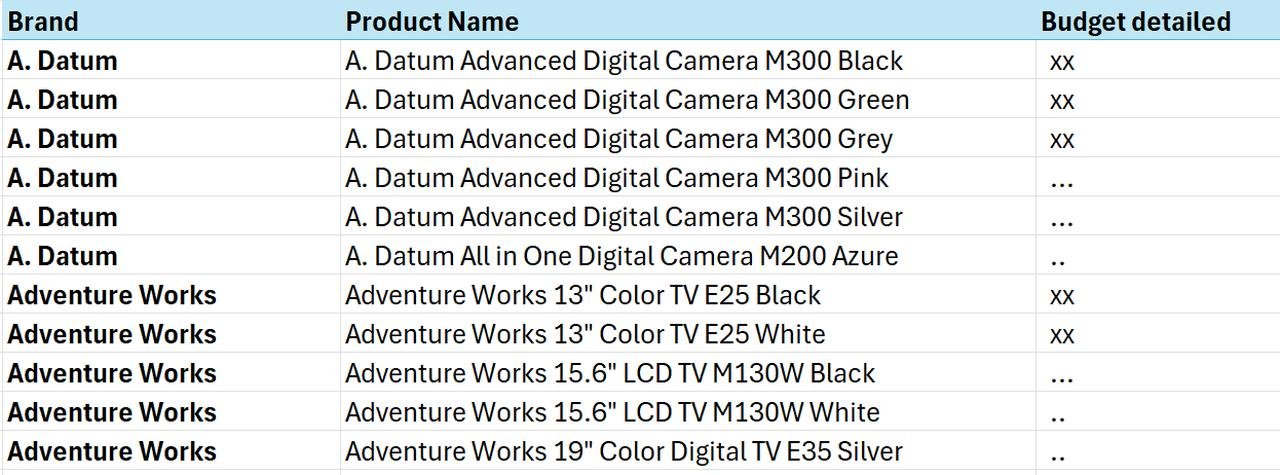
The goal is to have it broken down to something like this: based on last year’s actual sales percentages.
Contoso example
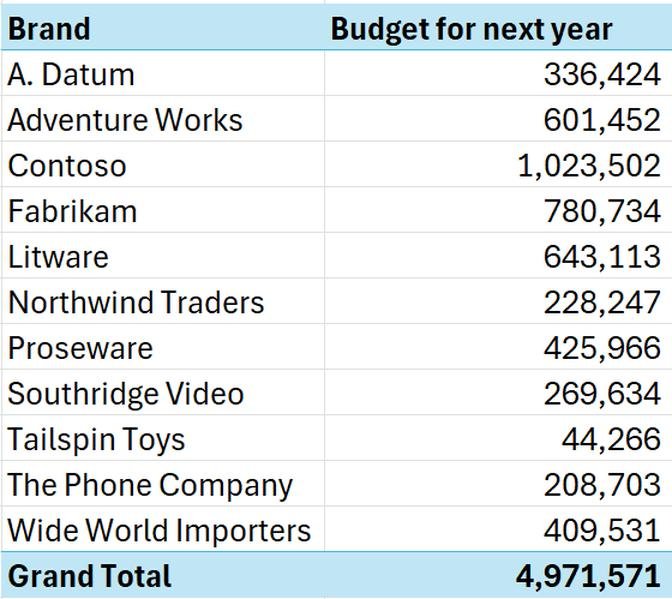
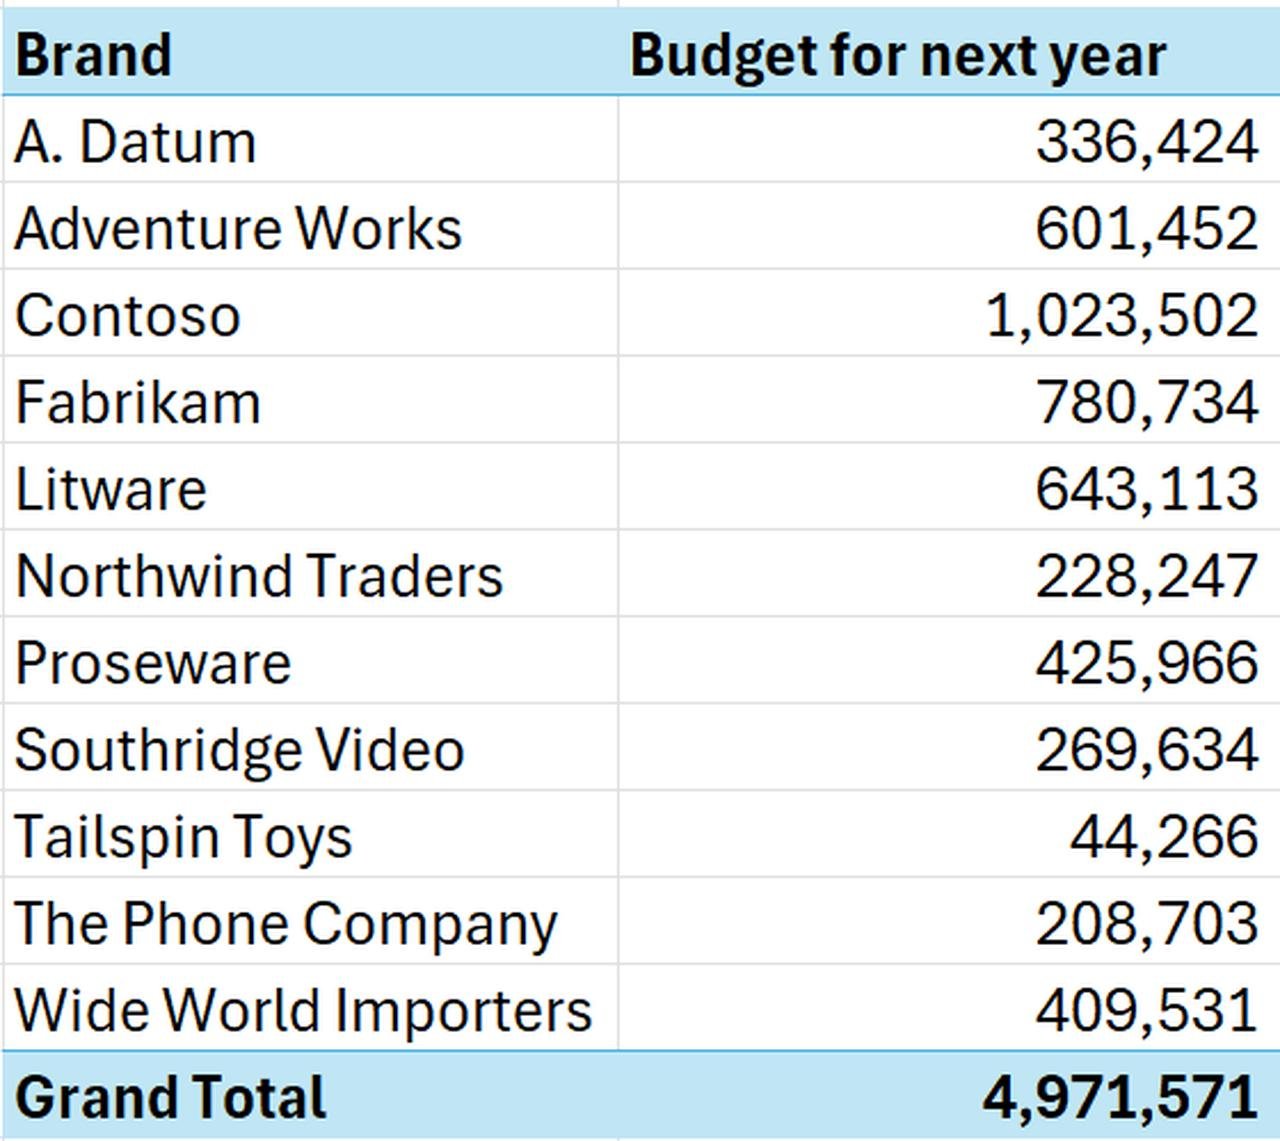
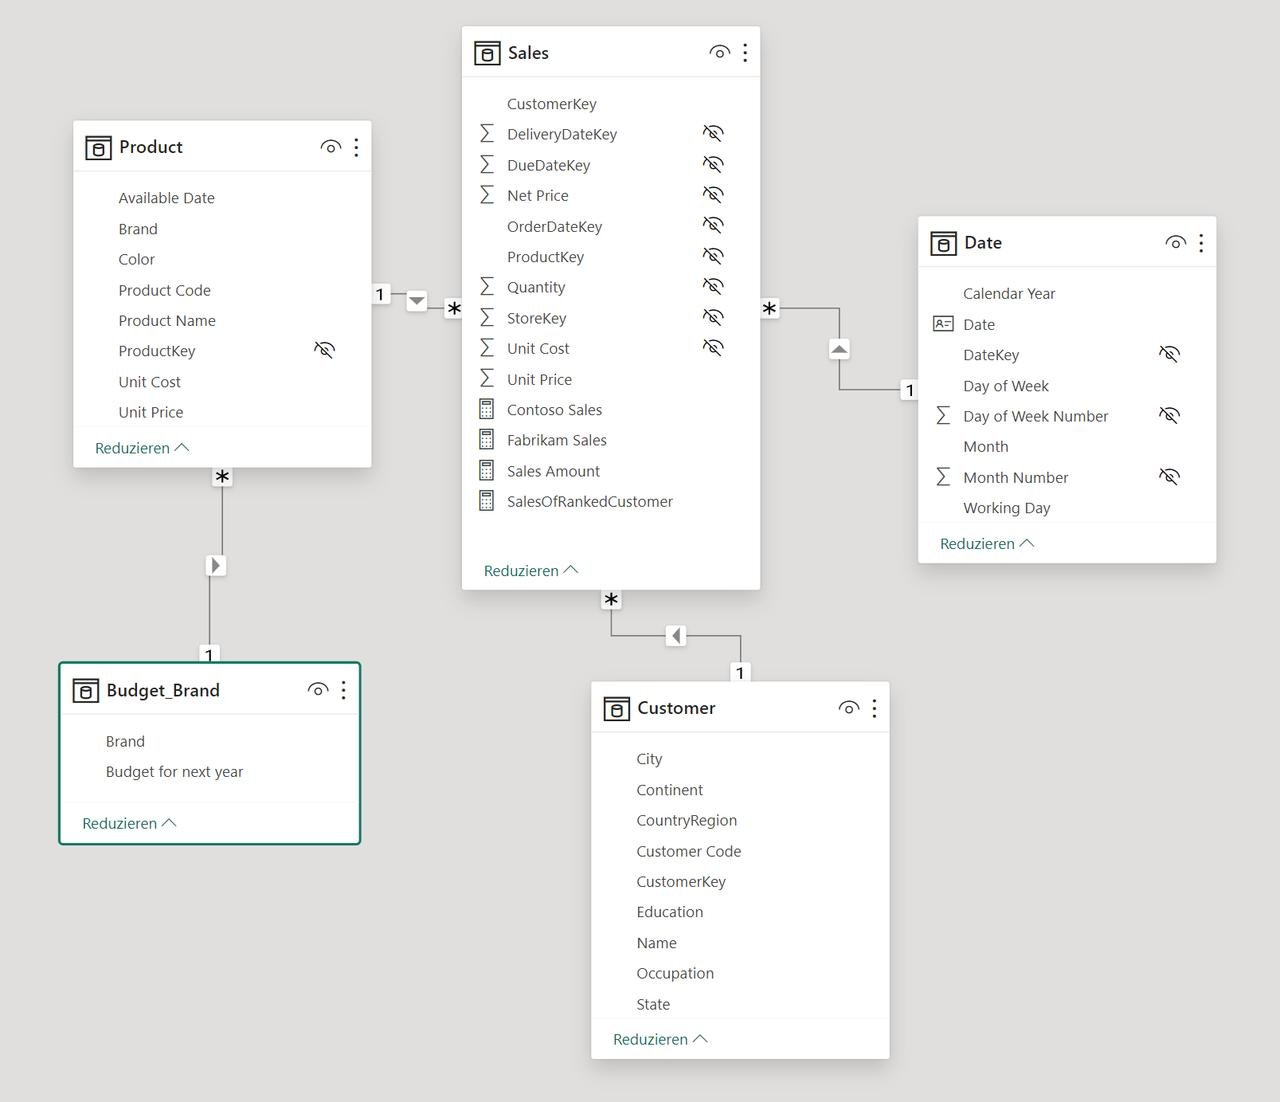
For this example, I am using Contoso database where Sales Contoso table joined with Product and Date table and our Budget_Brand table. In the Budget_Brand table, we create a measure for the Budget, so that later on we can access it in SUMX formula.
Budget for next year measure = SUM(Budget_Brand[Budget for next year])
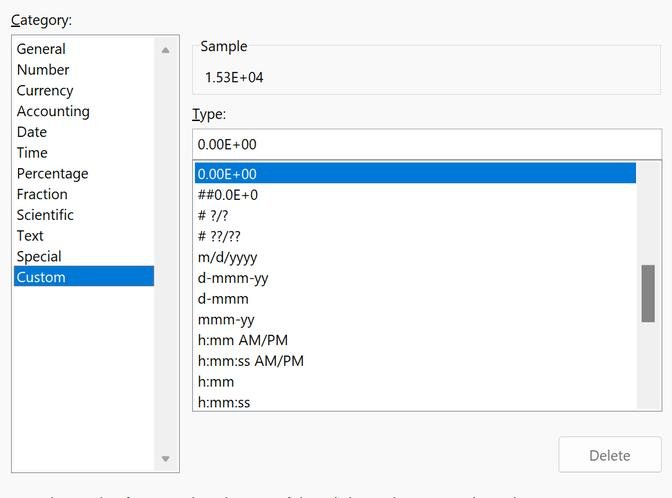
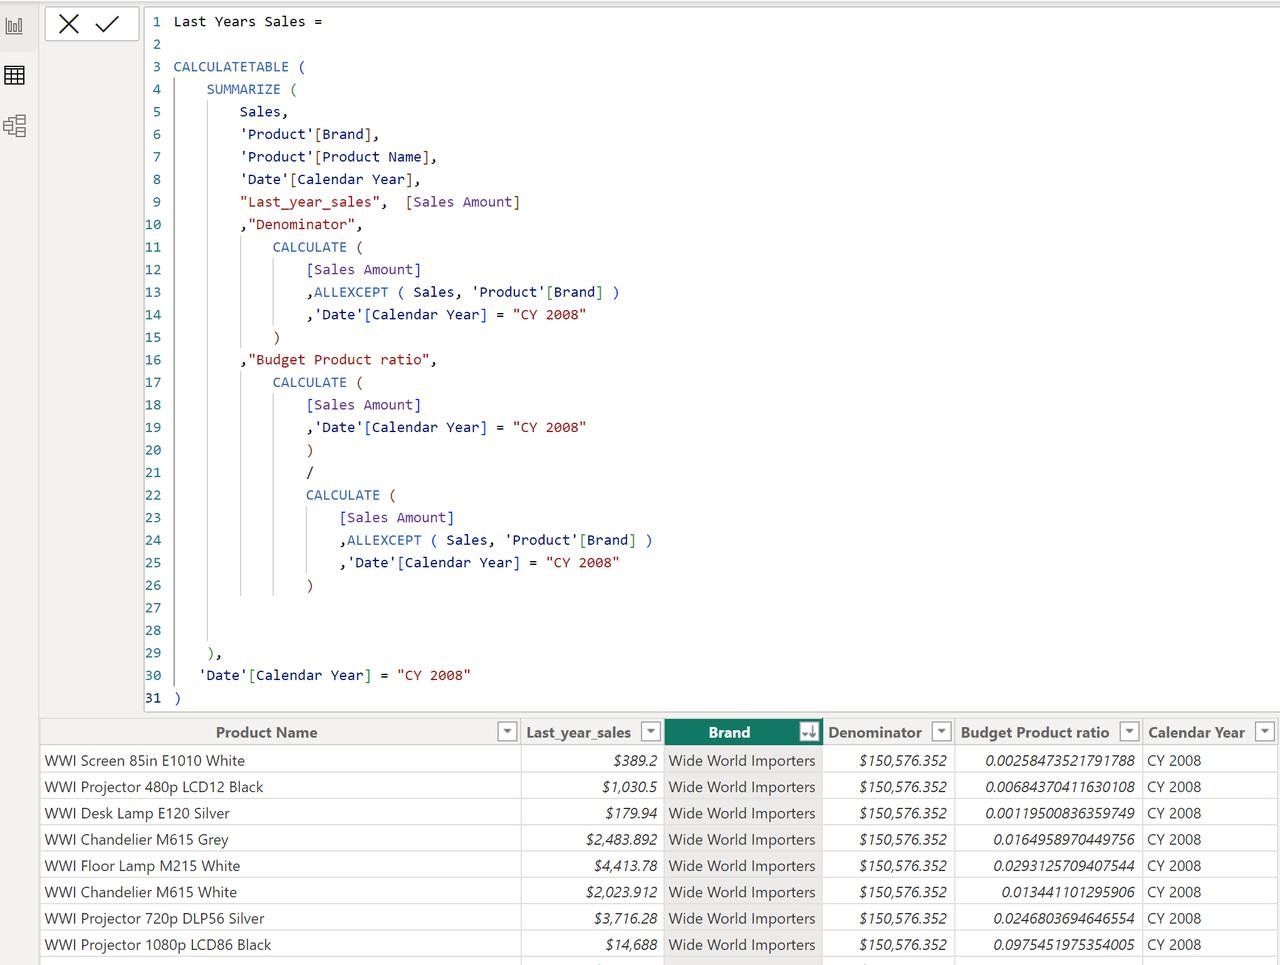
Let’s build a ratio table using virtual table function in Power BI. Or you can also import a flat table with mixes from another source, if the splits are not present in the model initially. What we finally need is the Budget Product ratio column that should split the high-level budget per Brand.
You can do it using CALCULATETABLE, SUMMARIZE formulas and use ALLEXCEPT to build ratio on Brand grain. (see below)
After creating Last Years Sales Table, make sure it is joined correctly to the dimensions. in our case it is Last Years Table[Product Name] to the Product table. If you are using an imported table with ratios that has multiple other dimensions, make sure all the dimensions are linked.
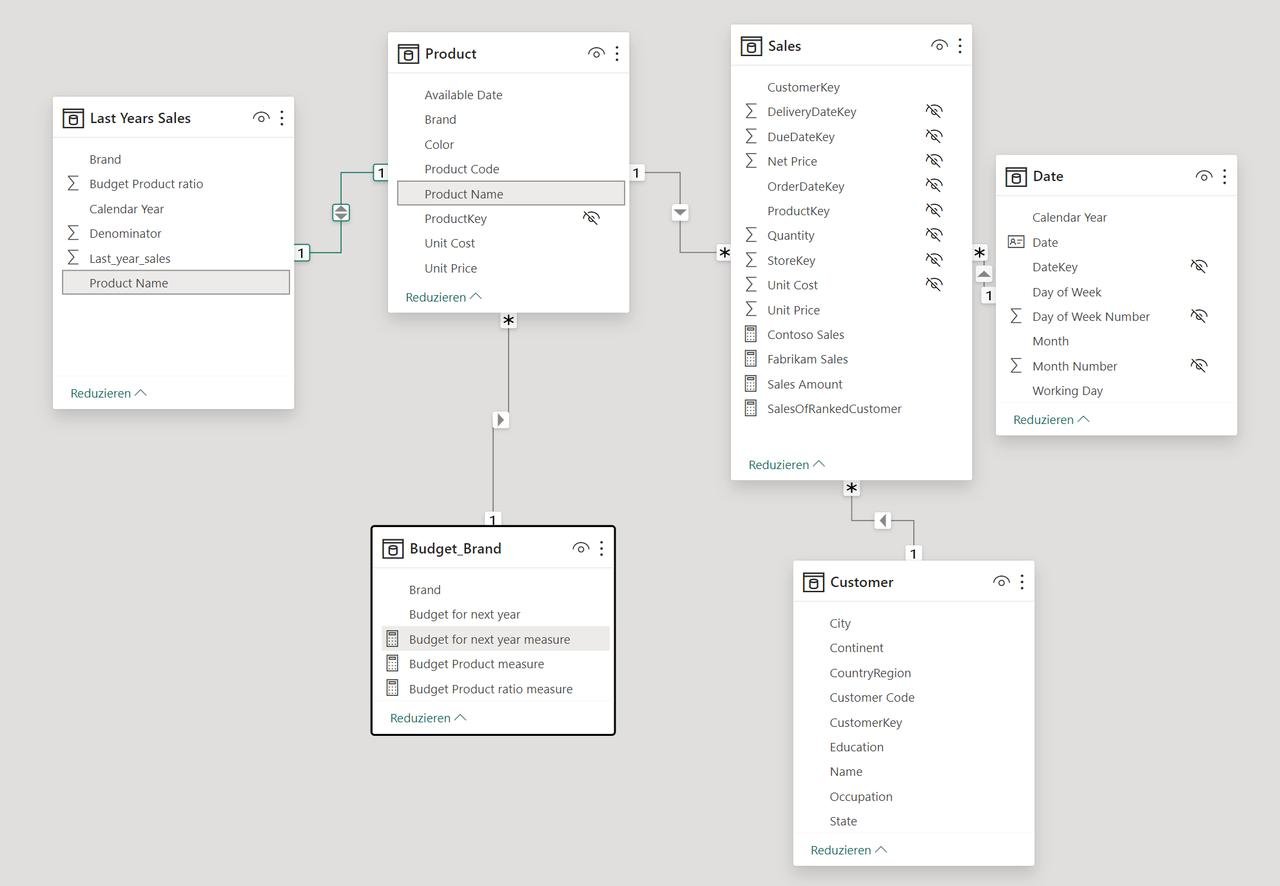
Now, using the ratio column and Last Year Sales table, we can calculate Budget per Product within Brand.
Budget Product measure =
SUMX('Last Years Sales' ,[Budget for next year measure] * [Budget Product ratio])
Check the results
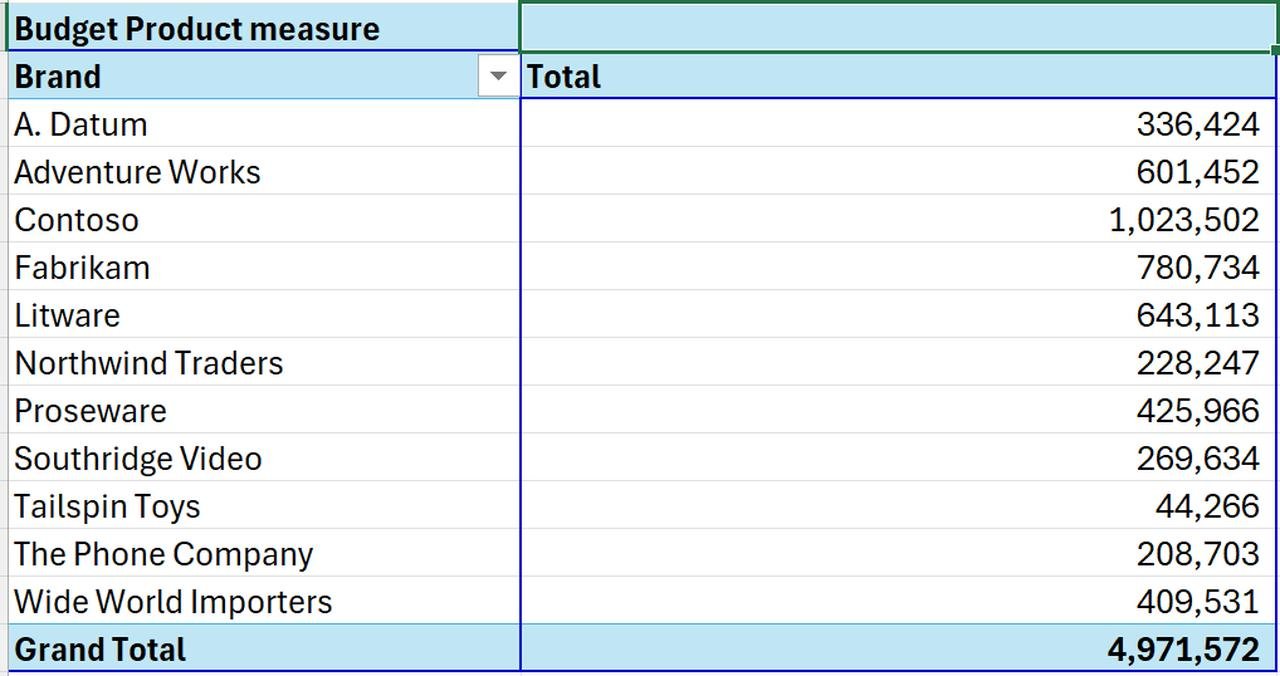
Now, if we check in the Analyze in Excel or in Power BI directly, we can see Budget split per Product within Brand using last year’s sales percentages.
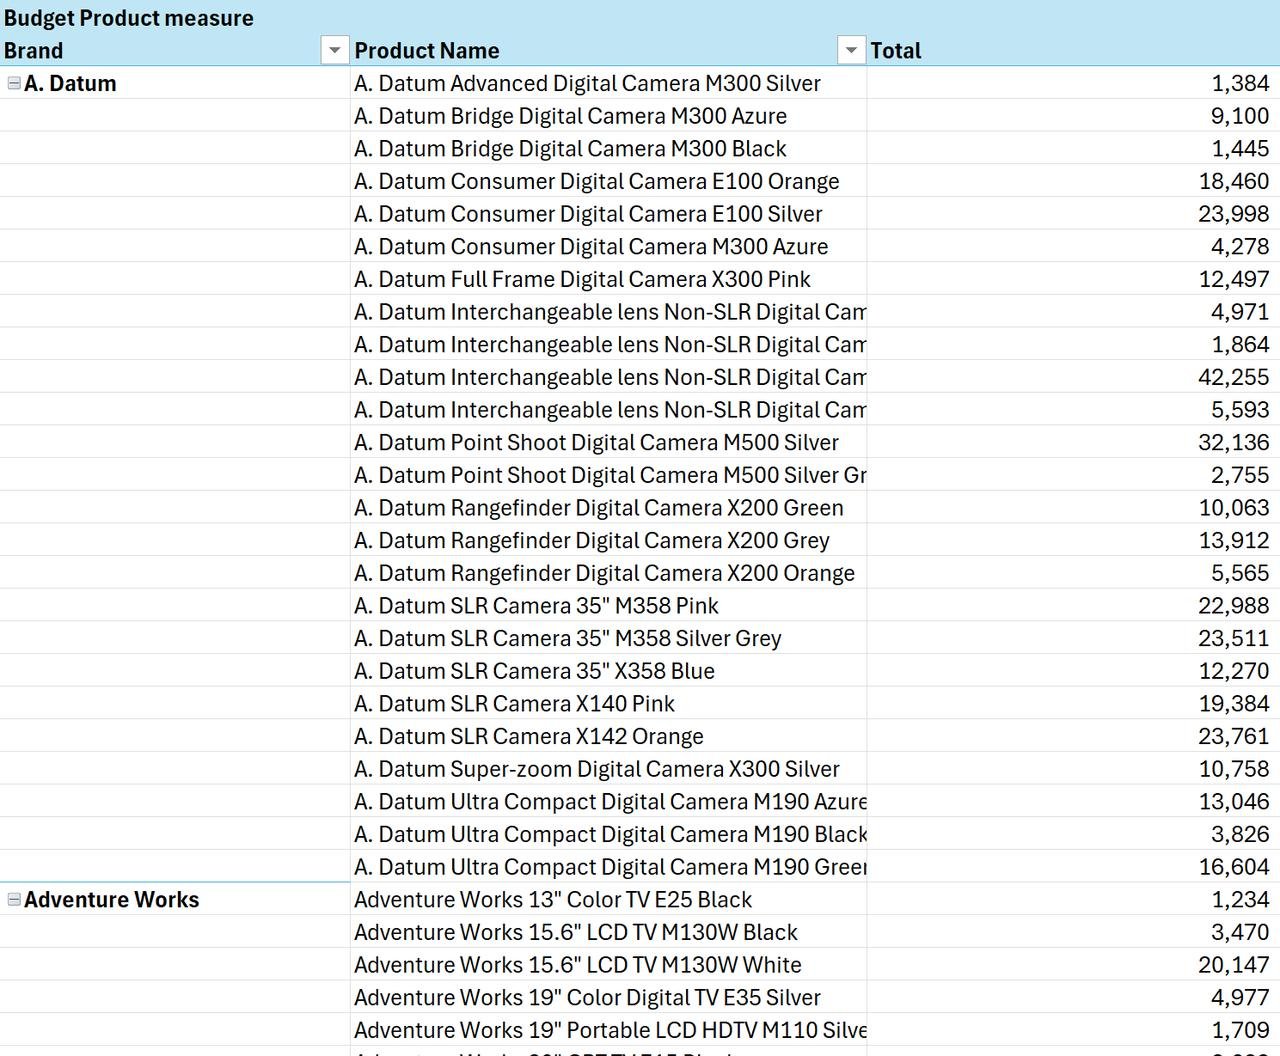
Make sure to check the Grand Totals and Totals per Brand in the overview to get 100% alignment! If you have one of the joins incorrectly, then totals will be off. It could be off by $1, as in my case below if your ratios are hard copied from excel due to rounding off.
Let me know what you think or if you have a better way to split budgets into more granular items dynamically.
Check my other post for calculating ratios in DAX here.