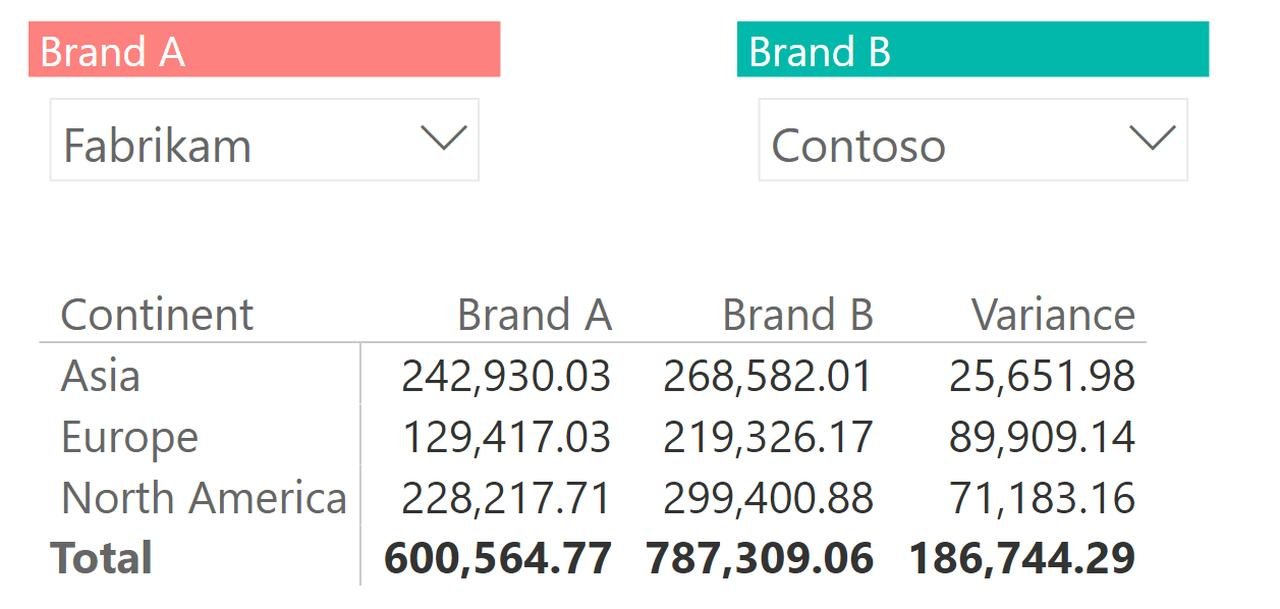

In Power BI there is a way to control the contents of a pivot table by using slicers. A user would compare different sets of data in the same pivot and calculate their variances. For example, if in the slicer 1, you select Brand A and in slicer 2, you select Brand B, then in the pivot you will see Brands A and B side-by-side and then their variance.
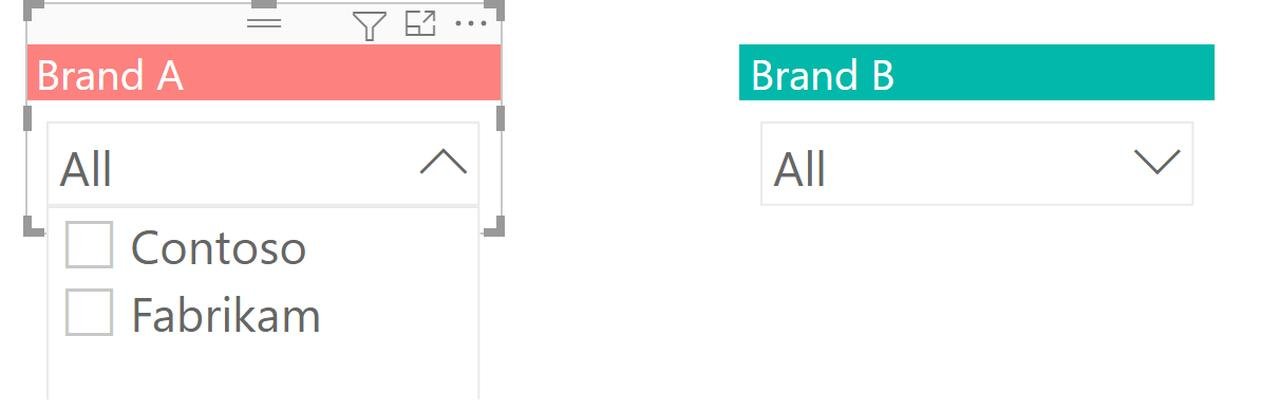
The slicers can look something like this: they will be used to determine which measures the pivot displays and compares variances.
After the slicers are created with 2 separate identical tables using column Brand Names, you need to link them to your pivot calculations. To do that you need to use Calculated Groups. Open your powerBI, External Tools, Tabular Editor.
To get Tabular Editor, you can download it for free here Tabular Editor.
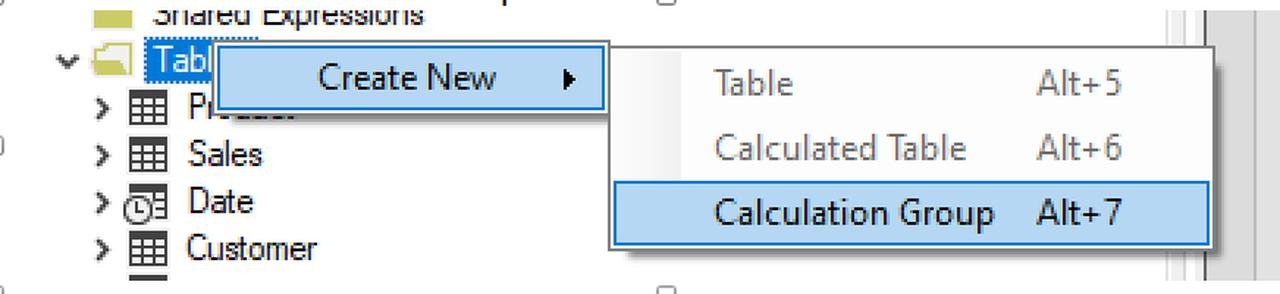
Create new Calculated Group in the Tables folder:
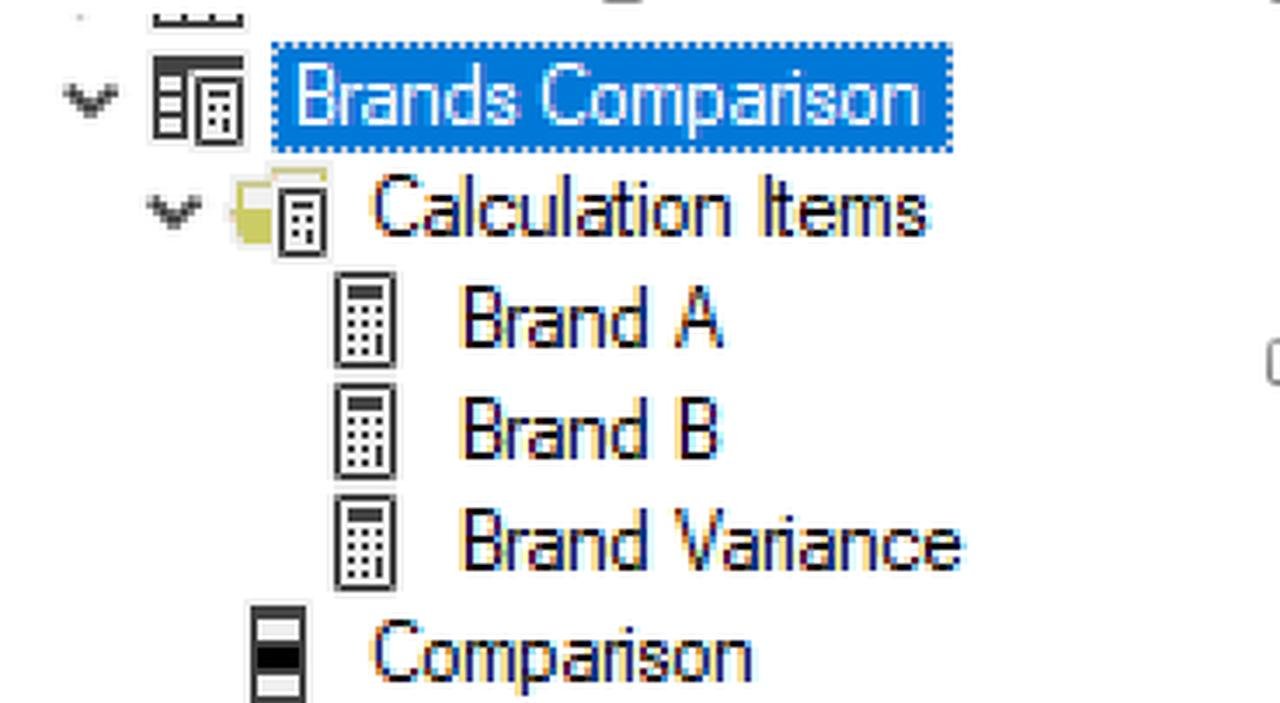
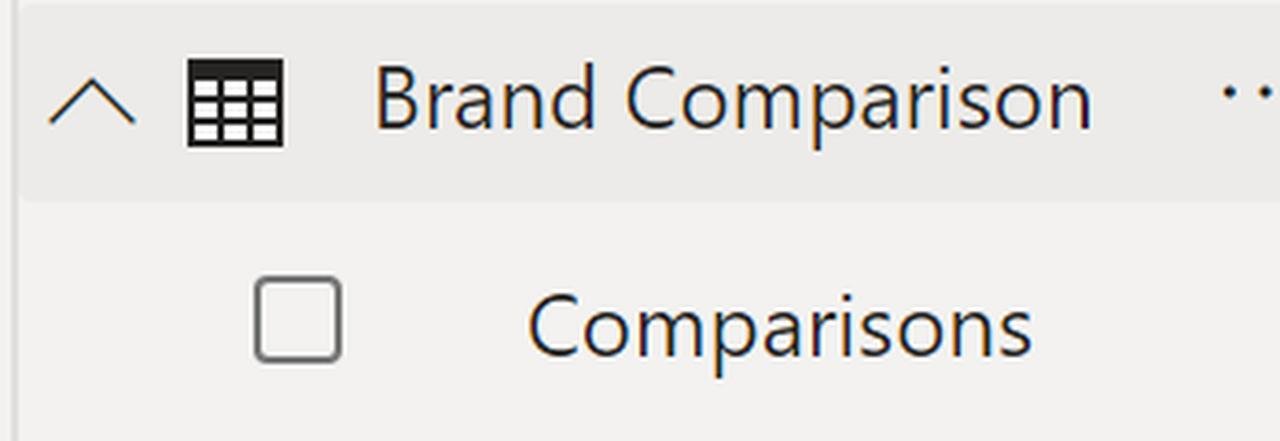
I named the Calculated Group as Brand Comparison. Created Brand A, Brand B and renamed "Name" into "Brand Variance". But its up to you how to name the fields.
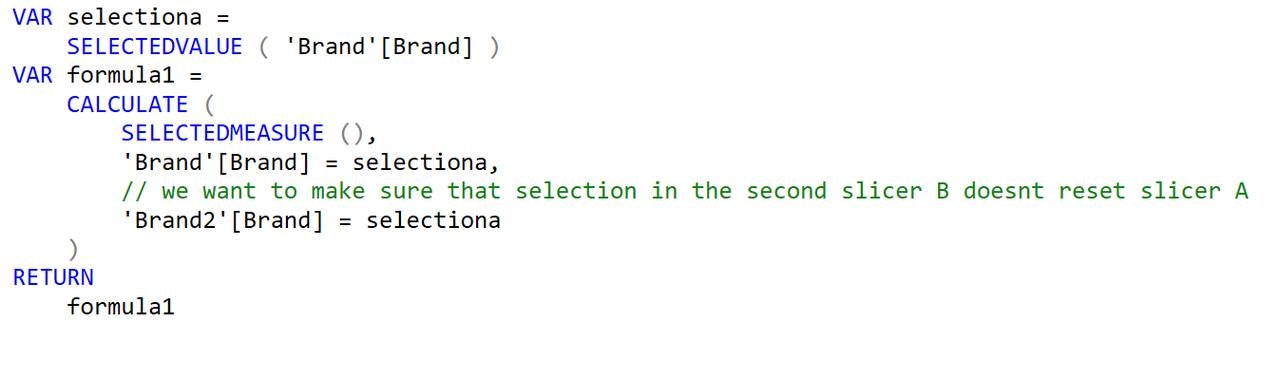
In Brand A item, you want to make sure that it is the measure you selected in slicer 1. But also make sure it doesnt get overridden by your selection in slicer 2.
SELECTEDMEASURE() is used conveniently to tell PowerBI that which ever Measure we put in the pivot (be it sales or purchases or inventory amount), it will apply same calculations to that Measure.
To do that we can write this DAX code:
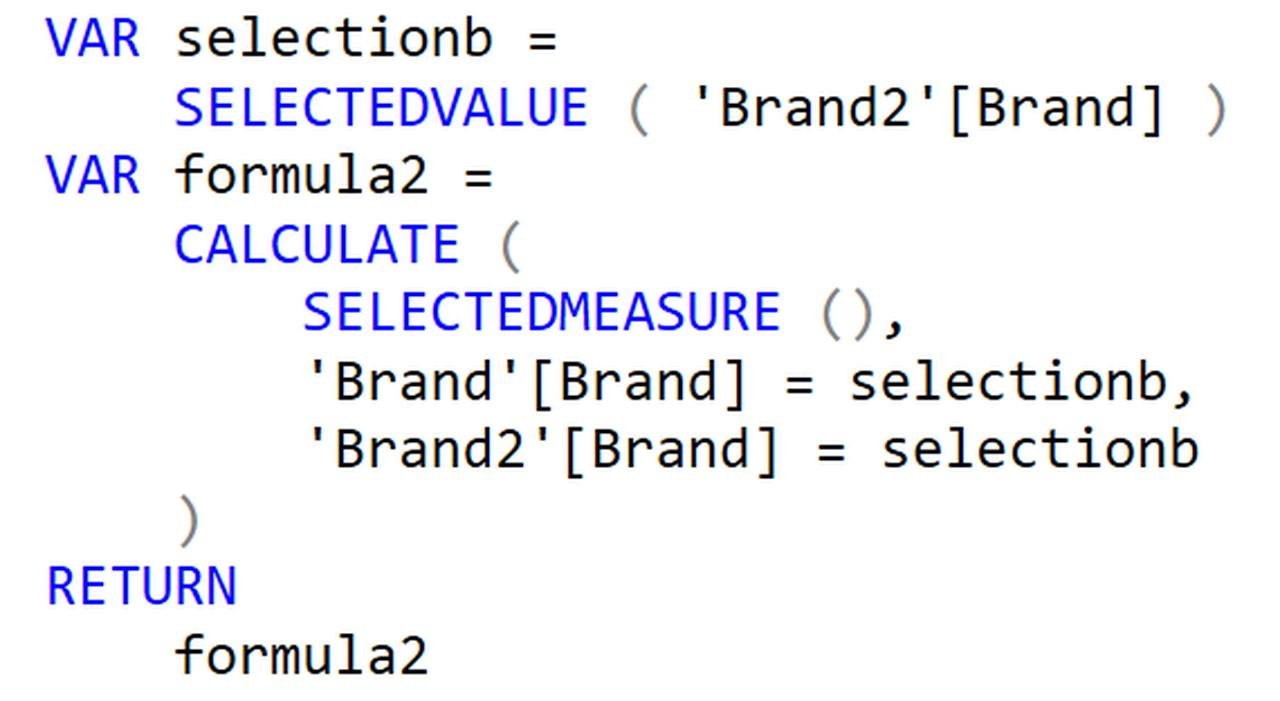
For Brand B item, we can write the following DAX. Also this time we specify that both slicers should be set to selectionb (what is selected in a second slicer) in order to not reset one another:
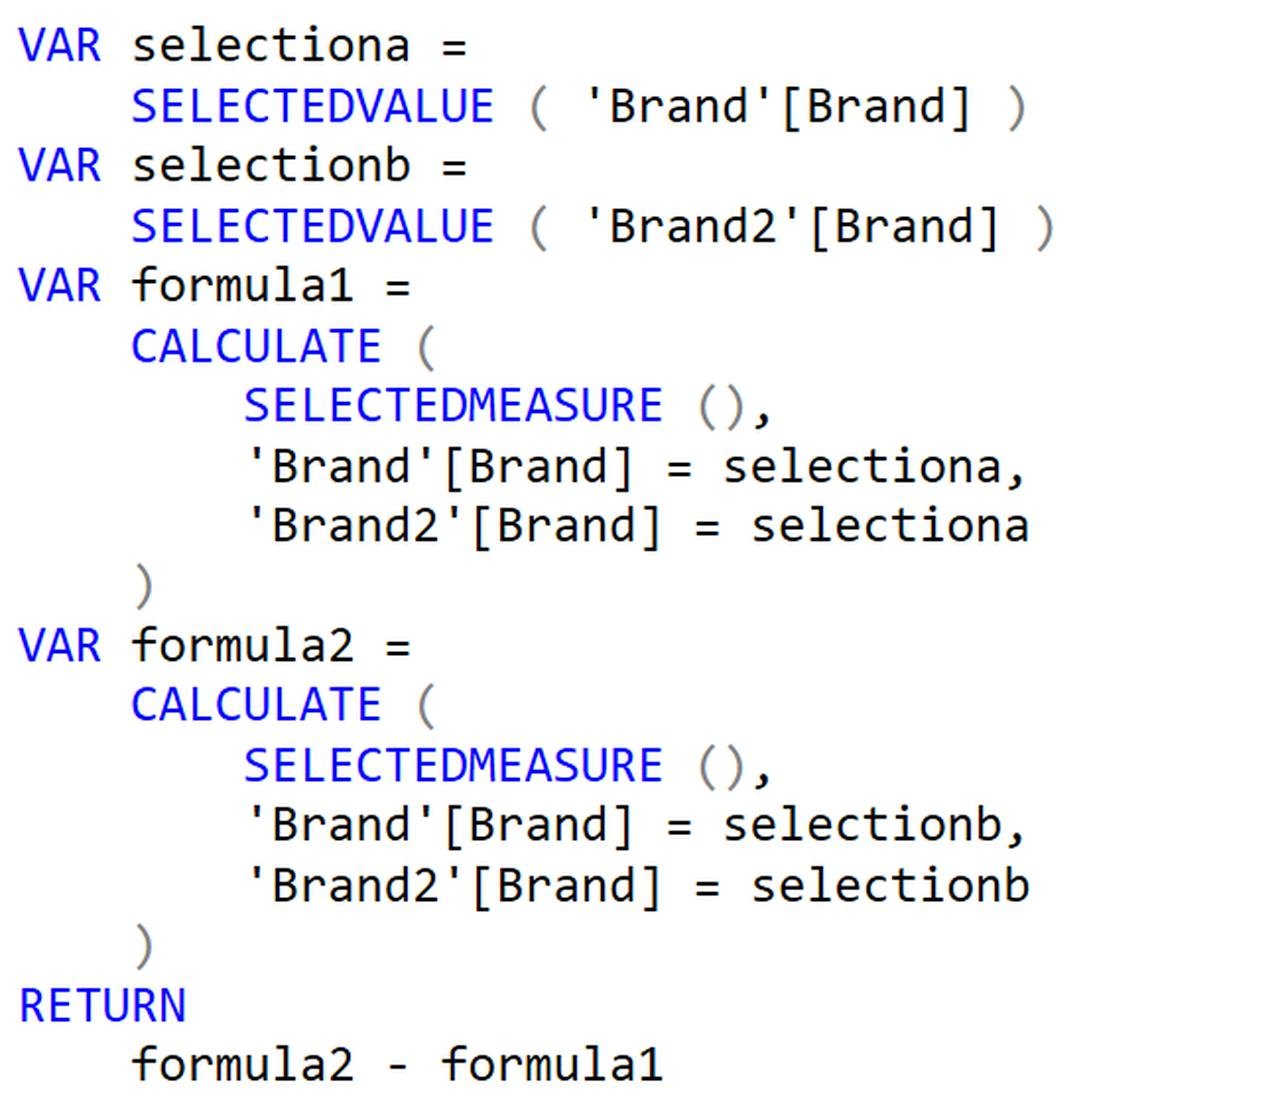
And for Variance item, we set the code as follows. It is just a copy of Brand A and Brand B code with a variance (formula 2- formula 1) at the end:
Once we save, we should see new field in the PowerBI that we created. if for some reason, it doesnt appear, then save PowerBI file and re-open it.
Pull Comparisons column into your pivot columns and insert any of the measures in the values of the pivot and you should be all set.